
The Geometry of the Neural Representation of Color
Details
This page contains the data and analysis for Rosenthal et al (2020), as described in the guide. The files here correct a mistake in the original report, fixing an error in the preprocessing pipeline that impacted an average of 4.6% of the trials per participant for the main experiment.
The error did not impact the main conclusions, but it did impact specific reported values in all data figures and two minor conclusions must be revised. The evidence that reddish colors are decoded with higher accuracy is weaker than reported, and there is no evidence that S-increment colors are decoded more accurately than S-decrement colors. The raw data remain unaffected (OpenNeuro).
Abstract
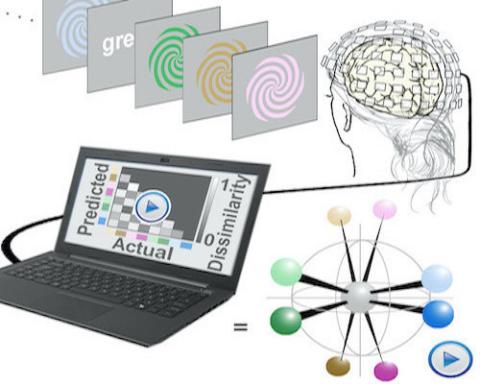
The geometry that describes the relationship among colors, and the neural mechanisms that support color vision, are unsettled. Here, we use multivariate analyses of measurements of brain activity obtained with magnetoencephalography (the MEGco dataset) to reverse-engineer a geometry of the neural representation of color space. The analyses depend upon determining similarity relationships among the spatial patterns of neural responses to different colors and assessing how these relationships change in time. We evaluate the approach by relating the results to universal patterns in color naming. The results provide a neural correlate of the greater precision in naming warm colors compared to cool colors, evident by an interaction of hue and lightness. Additional experiments showed that classifiers trained on responses to color words could decode color from data obtained using colored stimuli, but only at relatively long delays after stimulus onset, suggesting that the neural representations recovered in decoding color spirals is not attributed to cognitive factors. These results provide evidence that perceptual representations can give rise to semantic representations, but not the reverse.
Taken together, the results uncover a dynamic geometry that provides neural correlates for color appearance and generates new hypotheses about the structure of color space.
Geometry.zip (134.1 MB) - includes scripts for producing all the figures from the paper. There are guides in that directory with more information. Please see the PDF guide for details about what is contained in the zip file.
The decoding scripts used in the analysis are modified files from the Neural Decoding Toolbox that was graciously provided, with permission, by Ethan Meyers (Meyers, 2013). Anyone interested in using these files should contact Ethan Meyers directly, and cite his paper:
Meyers, E. (2013). The Neural Decoding Toolbox Frontiers in Neuroinformatics, 7:8
www.readout.info
Source code: https://github.com/emeyers/NeuroDecodeR
SI Videos
Classification Accuracy for Light Colors versus Dark Colors over Time, Relative to the Time Point of Peak Decoding (Computed for Each Participant Individually), Related to Figures 2C and 2D. Error bars show 95% CI.
Representational Dissimilarity Matrices over Time. At each time point, there is a confusion matrix produced from the performance of the forced error classifier. Values scaled 0 to 1.
Multidimensional Scaling Plot Showing the Relationships among the Patterns of Neural Responses (3D), Corresponding to Peak Decoding of Stimulus Onset (0 ms). Related to Figure 3D.
Multidimensional Scaling Plot Showing the Relationships among the Patterns of Neural Responses (3D), Corresponding to Peak Decoding of Stimulus Cessation (110 ms). Related to Figure 3D.
Other Resources
Explore other related resources and data that you may find it useful.